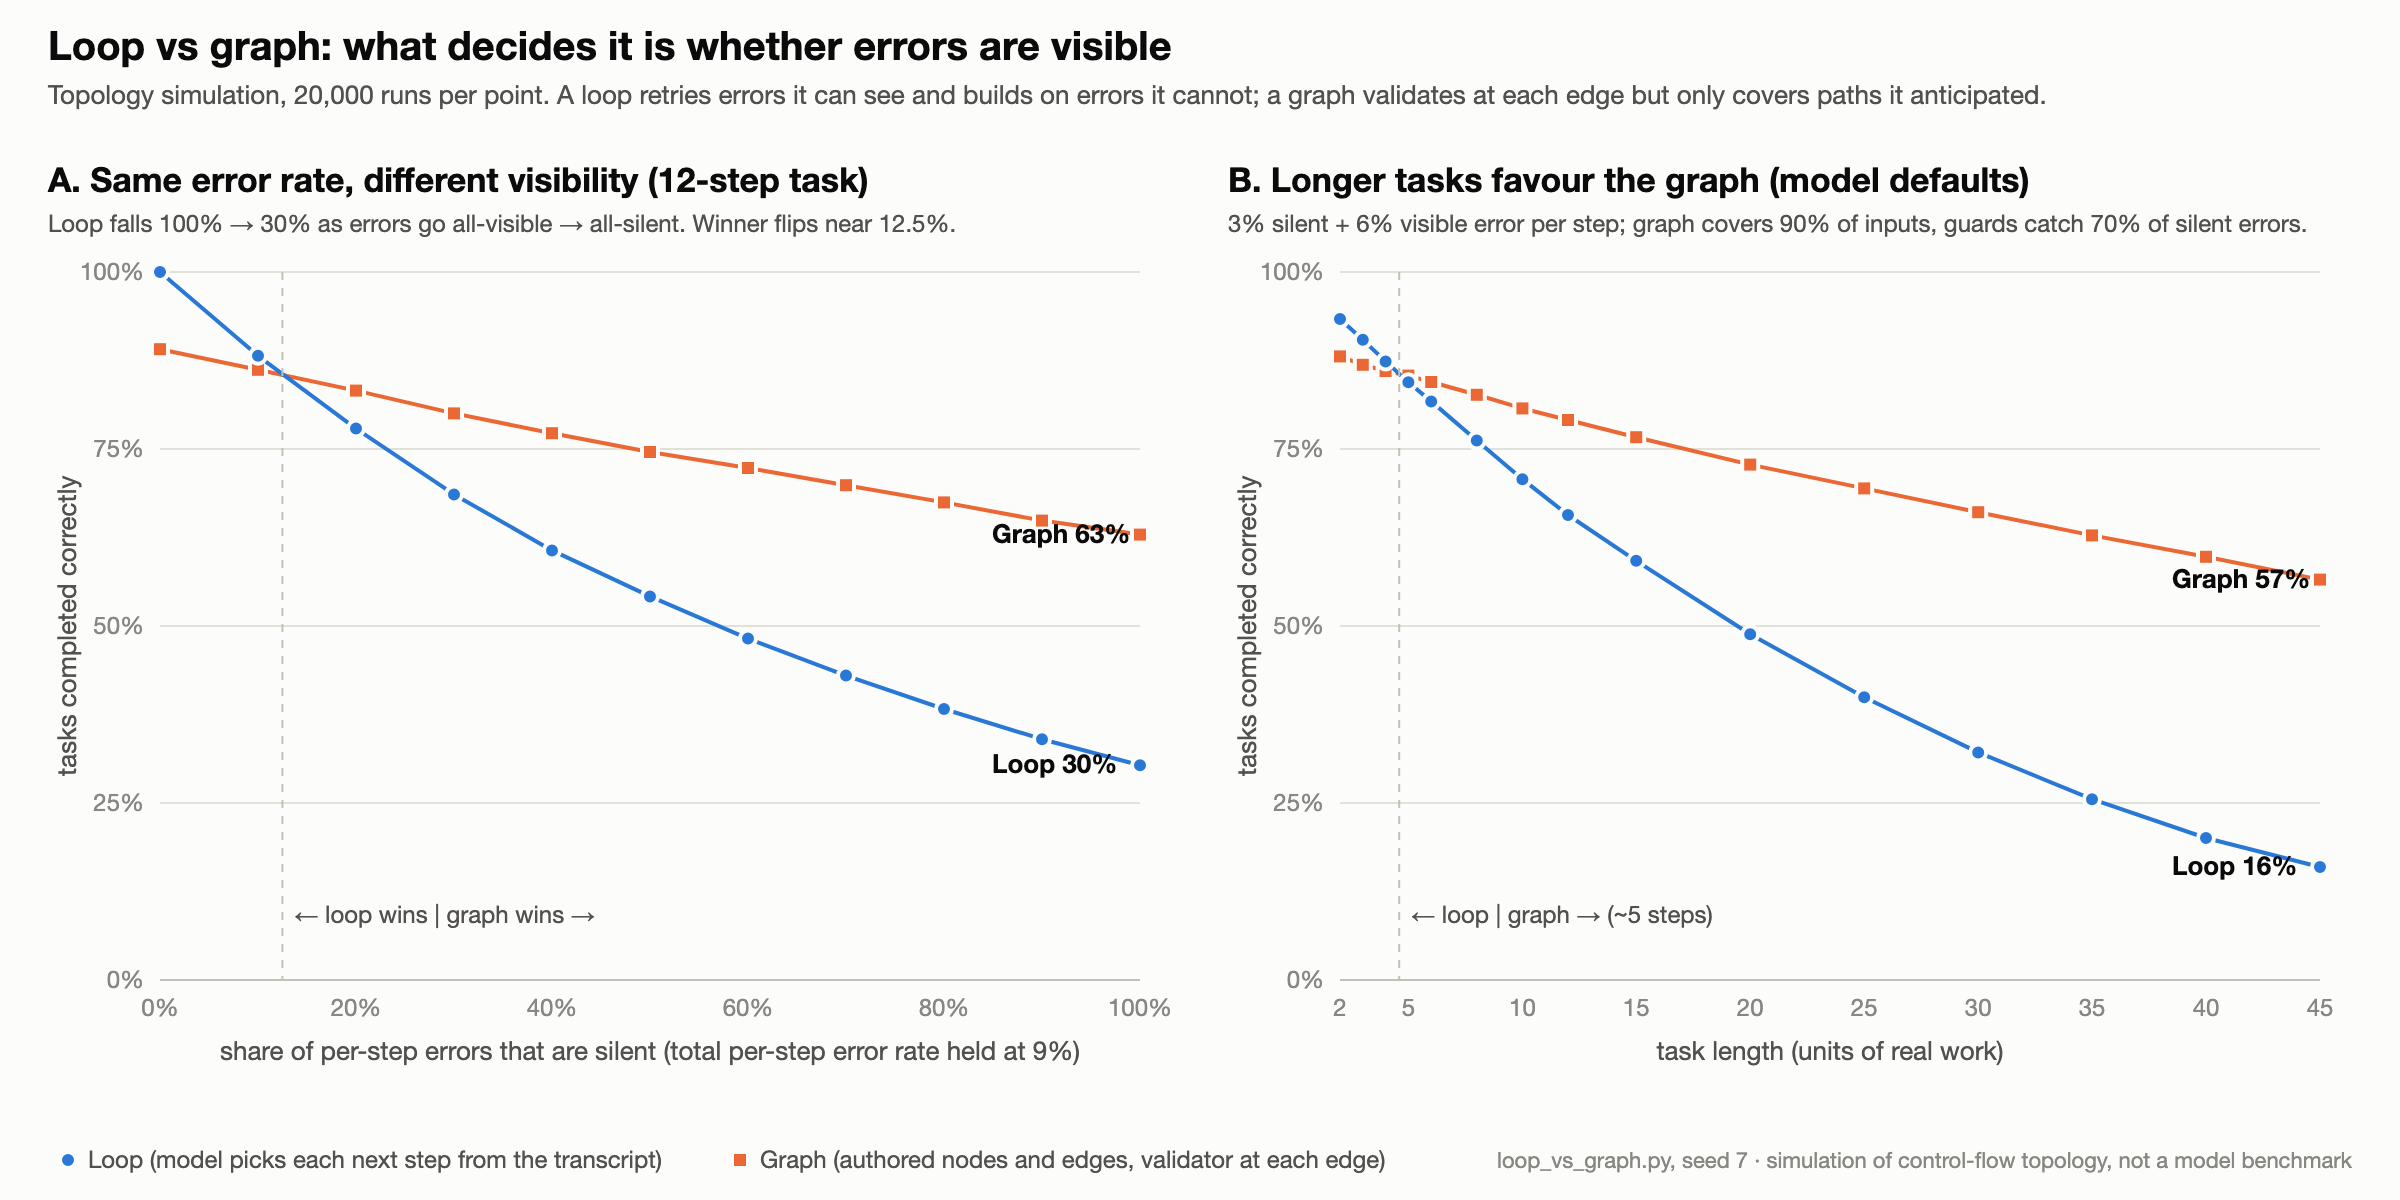
Take two agents with the same per-step error rate, 9%. In the first, every error is visible: an exception, a failing test, a schema violation. In the second, every error is silent: the step returns something that looks fine and is wrong. Give each a 12-step task.
In a simulation of the control-flow topology alone, the first agent finishes correctly 100% of the time. The second finishes 30% of the time. Nothing else changed.
That single variable also decides the argument this post is about. Run the same agent as an open loop (the model picks each next step from its transcript) or as an authored graph (nodes and edges written ahead of time, with a validator on each edge), and the winner flips once roughly one error in eight is silent. Below that, the loop wins. Above it, the graph does, and its lead widens with every step of task length.
Two ways to build an agent
A loop is a model in a while with tools. Step i+1 is chosen at runtime from what step i returned. Claude Code is a loop. A graph is control flow authored in advance; the model fills the nodes and code picks the path. LangGraph, Temporal, Step Functions, a plain DAG.
The rule I use: put the boundary where the branching logic lives. Branches you know at authoring time become edges. Branches you cannot know until runtime stay in a loop. Most good systems are a graph whose nodes contain small loops.
Why visibility is the hinge
A loop retries visible errors for free: it sees the traceback in the next turn and tries again. It is defenceless against silent ones, because it builds on them, and they compound multiplicatively down the rest of the task. A graph cannot retry any better than a loop can. What it has is edges, and every edge is a place to put a check that converts a silent error into a caught one.
The graph pays for that in coverage. An authored path only exists for inputs someone anticipated; the model charges it a flat 10% of inputs with no path at all. That is why the loop wins short tasks and why the crossover sits near five steps at default assumptions, moving out to somewhere between 11 and 25 steps when authored coverage drops to 70%, depending on how good the guards are.
The cost side is arithmetic
A loop's transcript is its state. Context grows every turn, so input tokens grow with the square of the step count. With a 2,000-token system prompt and 1,500 tokens per step, a 12-step loop reads about 5× the input of an equivalent graph that passes distilled state between nodes; at 80 steps, about 29×.
Prompt caching helps, but people over-credit it. Priced at a 0.1× cache read and a 1.25× cache write, Anthropic's standard ratios, caching divides the loop's bill by roughly 2.5× at four steps and 8× at eighty, approaching 10× in the limit. The newest models read their cache at 0.05× or 0.025×, which lifts that ceiling to 20× or 40×. Either way it divides the constant. The exponent survives untouched.
What checking the code changed
Before publishing I re-ran the model and checked every number in the doctrine I had written from it. Two claims did not survive as written.
I had written that silent-error rate and guard quality dominated the decision "far above everything else." The script's own sensitivity table ranks the retry budget first, task length second, silent-error rate third, and guard fifth of six. Retries topped the table only because the low end of its range was zero, which is a degenerate setting where a graph cannot recover from any error at all. Perturb every knob by the same relative amount and silent-error rate goes back to first, with coverage and guards tied behind it. Guard quality is also the knob that grows with task length: a 9-point swing at five steps, 49 at forty-five.
I had also written that context rot was nearly irrelevant. It was, at the script's settings, because a 12-step loop averages only about 18,000 tokens of context at completion, and the model's rot assumption barely moves error rates at that length. Assume silent errors double every 30,000 tokens instead and run 20 to 30 steps, and rot becomes a 16 to 23 point knob. The honest statement is that rot matters late and visibility matters everywhere.
Then I measured my own traces
A model tells you what topology forces. It does not tell you whether your work has edges worth authoring. So I wrote a small miner for my own coding-agent transcripts. It types each tool call by what it does (git status and python3 run.py are different states that share a transport), takes the entropy of each state's next-state distribution, and promotes transitions that are both frequent and near-deterministic into candidate edges, tiling so each transition is counted once.
On the first run, in August 2026 over a small early corpus, 3% of transitions were promotable and 64% of distinct transitions had occurred exactly once. I re-ran it in November over everything since: about 1,140 episodes and 20,500 tool calls. The promotable share came back at 20%, which looks like structure arriving. Mostly it is not. Of those promoted transitions, 94% are one step repeating itself: search after search, fetch after fetch, the same mailbox operation hundreds of times. That is a for loop, a batch node at most. Chains of different steps, the thing an authored workflow is made of, cover 1.3% of transitions. And 62% of distinct transitions have still occurred exactly once.
So my interactive usage is still loop-shaped; a graph would underfit it and I would maintain edges that fire once. What qualifies is narrow: bulk operations against a connector, runs of web research, and a handful of short fixed sequences.
That result carries real caveats. It is one user and one coding agent. The typing scheme makes every unmapped command its own state, which inflates the singleton rate, and those singletons are 62% of distinct transitions but only 11% of traffic. I have verified the miner's mechanism against a synthetic corpus with known structure; nobody else has run it on their own traces.
What to do with this
- Every edge is a chance to validate. A schema check, an assertion, an evaluator node. Converting one silent error into a caught one buys more than any prompt edit.
- Bound what crosses a node boundary. Pass distilled state, not transcripts. Write large artifacts to disk and pass a handle.
- Match the instrument. A loop's control flow is a distribution: evaluate it over many runs. A graph's is a value: unit-test the node.
- Harvest loops into graphs. Run the loop first, mine the traces, promote only what the data says. Keep a loop as the fallback branch for the tail.
- Test the mechanism before debugging the artifact. If a rule does not fire, first prove the engine executes any rule at all.
Limitations
This is a topology model, not a model-quality benchmark. Every rate in it is an assumption, and the headline result follows from one of them: a silent error poisons the run, a visible one costs a step. I think that assumption is the mild one everybody already accepts; the point is what it forces once you accept it. The trace mining is n=1 and unreplicated. The code, the seed, and the sensitivity re-checks are in the repository so you can move the assumptions and watch the conclusions move.
Code: github.com/lymnal/loop-vs-graph. Corrections and counterexamples: open an issue there, or email esam5556@gmail.com.